Linux 下使用 callgrind 比较算法效率

Contents
主要内容
如何比较算法效率, 这是我们在调试算法的时候可能需要比较不同的算法的效率, 在算法优化的时候也有需要去查看那些函数是比较耗时的, 这里就介绍Linux下使用callgrind来看看程序的运行细节.
解决问题
这里使用ffmpeg来做例子, 下载源代码FFmpeg 4.4 “Rao” 和 Valgrind 3.17.0
ffmpeg编译方法:
./configure --enable-static --disable-x86asm --disable-pthreads --disable-w32threads --disable-os2threads --disable-asm --disable-inline-asm
上面的部分选项主要是方便调试.
--target-os=mingw32 // Windows10 Msys2
生成Makefile文件后建议修改一下ffbuild\config.mak文件,也是方便后面使用gdb调试:
CFLAGS: -O3 -> -Og
关于GCC优化选项说明[1]:
-O3
Optimize yet more.
-O3  turns on all optimizations specified by  -O2  and also turns on the following optimization flags:

-fgcse-after-reload
-fipa-cp-clone
-floop-interchange
-floop-unroll-and-jam
-fpeel-loops
-fpredictive-commoning
-fsplit-loops
-fsplit-paths
-ftree-loop-distribution
-ftree-partial-pre
-funswitch-loops
-fvect-cost-model=dynamic
-fversion-loops-for-strides
-Og
Optimize debugging experience.
-Og  should be the optimization level of choice for the standard edit-compile-debug cycle, offering a reasonable level of optimization while maintaining fast compilation and a good debugging experience. It is a better choice than  -O0  for producing debuggable code because some compiler passes that collect debug information are disabled at  -O0.

Like  -O0,  -Og  completely disables a number of optimization passes so that individual options controlling them have no effect. Otherwise  -Og  enables all  -O1  optimization flags except for those that may interfere with debugging:

-fbranch-count-reg  -fdelayed-branch
-fdse  -fif-conversion  -fif-conversion2
-finline-functions-called-once
-fmove-loop-invariants  -fmove-loop-stores  -fssa-phiopt
-ftree-bit-ccp  -ftree-dse  -ftree-pta  -ftree-sra
Valgrind编译方法[2]: 解压后直接make, 没有太多问题. 但是运行的时候需要注意: 如果没有直接安装且直接运行的话就会有以下错误,
valgrind: failed to start tool 'callgrind' for platform 'amd64-linux': No such file or directory
只需要定义一个环境变量:
export VALGRIND_LIB=/mnt/linux/valgrind-3.17.0/callgrind
./coregrind/valgrind --tool=callgrind ffmpeg -i 1.mp3 1.wav
执行成功后会生成callgrind.out.***文件, 这个文件就记录了ffmpeg的执行信息,
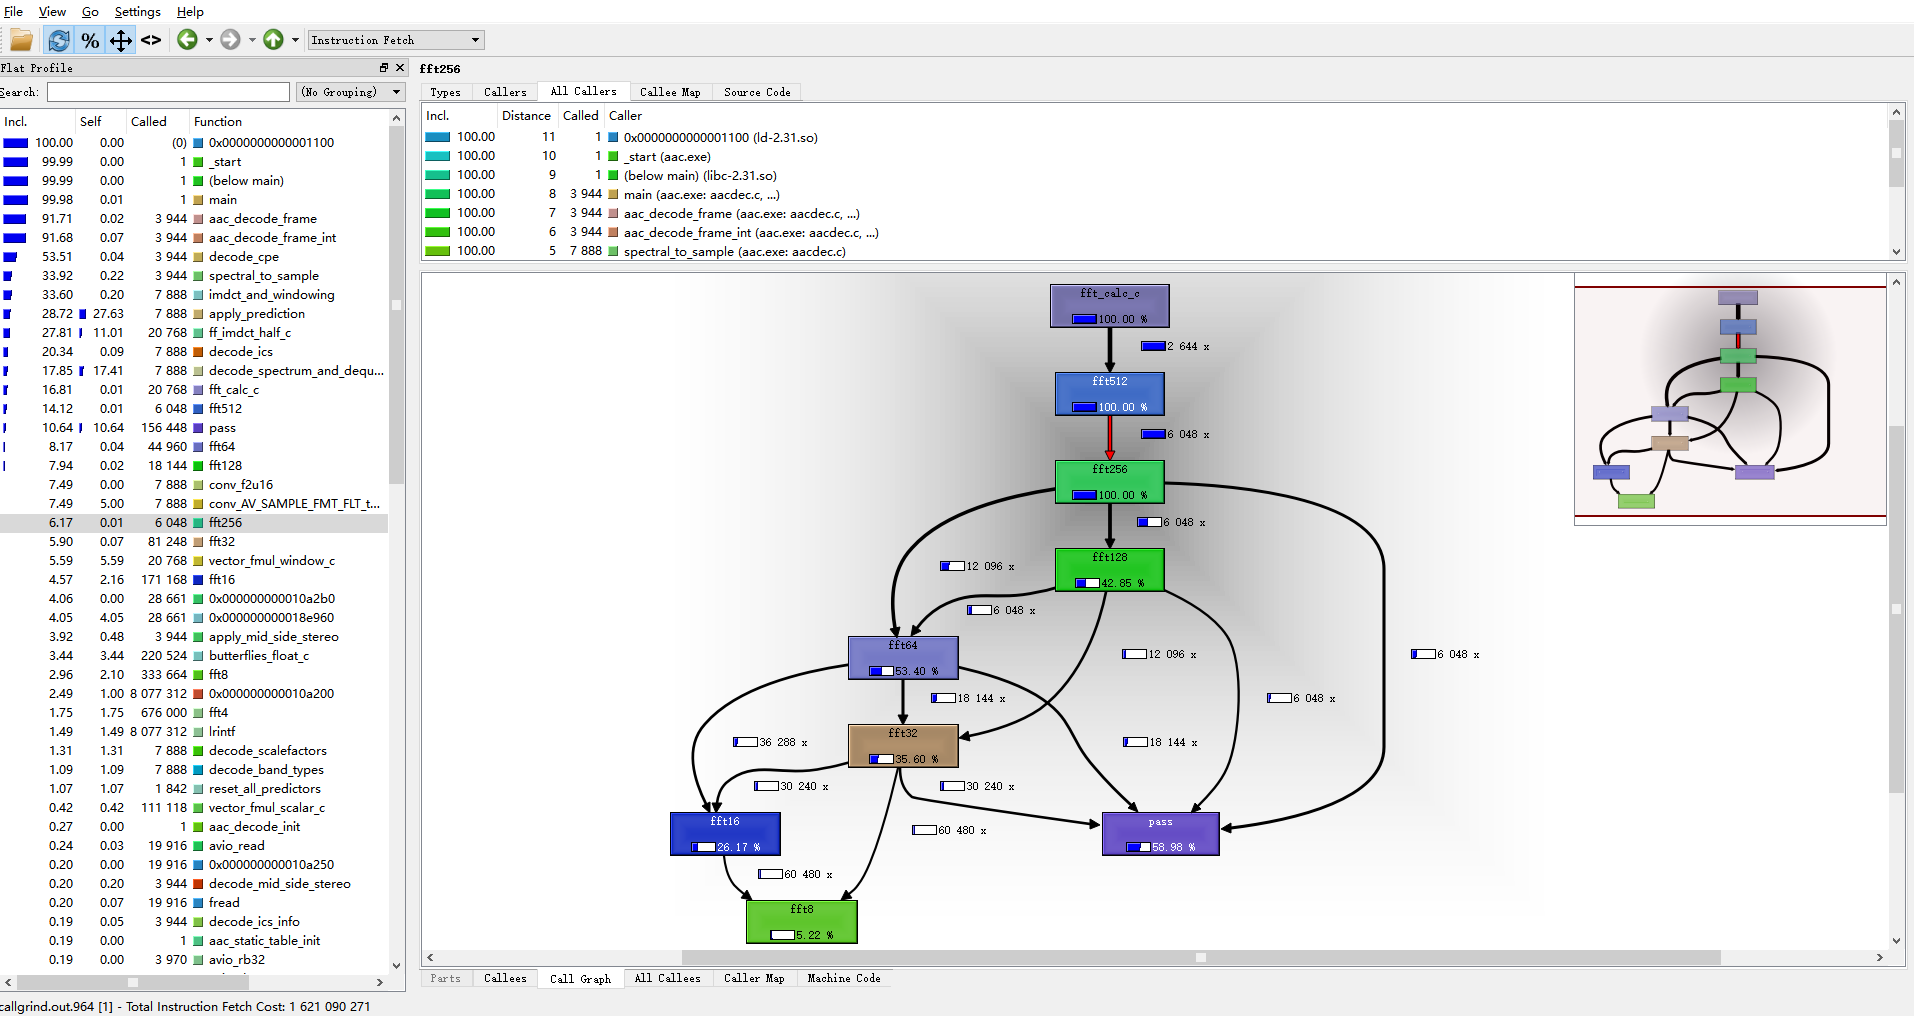
这里我们使用qcachegrind软件来查看callgrind.out文件,
如下图所示, 可以看到所有函数的调用栈, 以及耗时比例, 极大的方便我们后续的优化调试.
参考引用
[1]https://gcc.gnu.org/onlinedocs/gcc/Optimize-Options.html
[2]https://gernotklingler.com/blog/gprof-valgrind-gperftools-evaluation-tools-application-level-cpu-profiling-linux/